The emulators use scan-based emulation which is a nonintrusive approach to system emulation and debug. The emulator connects to a 14-pin header that must be designed into the target board. This header consists of a power signal, a clock signal, a clock return signal, some ground signals, 5 JTAG pins and 2 Emulation pins of the C4x. Using the scan path, the emulator can run and halt any of the C4x devices in the scan-chain and scan in and out all of the bits of each register.
TMS320C4x Debugger Interface
The TMS320 Debugger Interface is used with all TMS320 Simulator and Emulator products including the C4x Simulator and the C4x XDS510/XDS510WS Emulator Debugger.

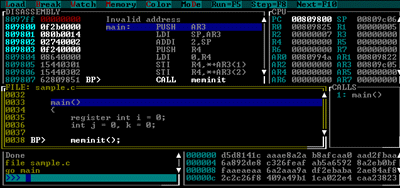
The Debugger allows you to run and halt the processor; view and modify registers, memory values and C variables; and view disassembly and C source. Debugger features include:
- Ability to start and halt the C4x with single-step (step-into), step-over (next), run, and halt commands.
- A friendly window-, mouse-, and menu-oriented user interface that reduces learning time and eliminates the need to memorize complex commands.
- Support for debugging in C, assembly language, or both.
- Profiling capabilities that show where to focus development time by identifying time-consuming sections of the program.
- CPU window that displays the values of the DSP registers.
- Disassembly window that displays the address, opcode and disassembly of the program and highlights the current instruction.
- C source window that displays the C code and highlights the current line.
- Memory window that displays the values of a block of memory in any format specified.
- Watch window that displays the values of variables in their native C format (float, int, char, enum or pointer) or lets you choose a different format.
- Display windows that display the values of arrays and structures.
- Command window that can be used to enter commands and view the response to commands.
- Pull-down menus and function keys that provide quick access to frequently-used commands.
- Ability to point the mouse, click and type in order to change the value of data in any window.
- Screen update whenever the C4x halts.
- Support for a powerful command set
- Configurable screen colors, window sizes and window positions.
- Ability to set and clear software breakpoints in the disassembly or C source windows with a mouse click.
Works with these Devices:
TMS320C4X